

Hello Odoo developers, Odoo offers various types of views like tree, form, kanban, calendar, and graph views, and in this article, we will let you know how to create Gantt view in odoo 17. Each type of view uniquely represents data, such as the graph view presents data in different types of graph views like line charts, pie charts, and many more.
It makes data easier to understand. You can see these view options in almost every menu in Odoo, but here in this blog post, we will introduce you to one of the advanced views in Odoo, known as the Gantt view, and we will let you know how to create Gantt view in Odoo 17 or an odoo Gantt chart.
With the release of Odoo 17, Gantt view continues to play a vital role in modules like Projects, Planning, and Manufacturing. But what if you’re building your custom module and want to integrate this interactive timeline view?
Table of Contents
What is a Gantt View in Odoo?
A Gantt view is a horizontal bar chart that visually represents scheduled tasks or resources over time. In Odoo, it’s used to plan and track:
- Project tasks
- Employee schedules
- Manufacturing orders
- Rental time slots
Each bar represents a task or resource allocated for a specific time frame, making it easier to plan and optimize workflow.
Gantt views are interactive in Odoo — you can drag, resize, or reorder tasks, making real-time planning intuitive and collaborative.
Why Use a Gantt View?
Here are a few common scenarios where Gantt views shine:
| Use Case | Benefit |
|---|---|
| Project Management | View deadlines, dependencies, and overlapping tasks |
| Employee Scheduling | Allocate resources or employees across projects or shifts |
| Manufacturing Orders | Plan production timelines based on availability and dependencies |
| Services & Rentals | Schedule time blocks for equipment, meeting rooms, or vehicles |
Instead of looking at flat lists or calendar views, Gantt charts help teams see the bigger picture at a glance.
How to Create Gantt View in Odoo 17
Gantt view is only supported in the Odoo Enterprise edition because it requires the installation of the ‘web_gantt’ module, which is available in the Enterprise edition. You can find and install the module under the Apps menu in Odoo.
Now, let’s understand the Gantt view in Odoo. You know about bar charts in Odoo, right? They can be either horizontal or vertical. Well, in Odoo’s Gantt view, we use the horizontal type.
Here’s an example: The image below shows the Gantt view in the Planning module, and after that, we will discuss how to create Gantt view in odoo 17

Gantt view allows you to plan out your projects, schedules, or anything else you need to organize. It offers a more visually appealing and user-friendly interface.
First, we need to understand how the Gantt view works and what attributes and elements we need to create a Gantt view in Odoo
Main Element: Gantt Tag
Attributes: String, Start Date, Stop Date, Default Group by, Progress, Default Scale, Scales, Precision, Color
These are just a few examples of attributes; you can also add more advanced attributes as needed, just like in any other view.
Let’s start creating a basic Gantt view with essential attributes like start date, stop date, and group by.
First, we need a model to represent our Gantt view. Below is an example of a model with parameters for date_to, date_from, and employee_id. You can add more fields according to your view requirements.
from odoo import fields, models

class SimpleGantt(models.Model):
   _name = 'view.gantt'
   _rec_name = 'partner_id'

   partner_id = fields.Many2one('res.partner')
   start_date = fields.Date(string='Start Date')
end_date = fields.Date(string='End Date')Here we defined a model named “view.gantt” with three fields: start_date, end_date, and partner_id. You can add more fields as needed for your specific requirements.
Now we need an XML file for displaying the Gantt view, and we have to use the Gantt tag along with its attributes.
<?xml version="1.0" encoding="UTF-8" ?>
<odoo>
   <record id="view_gantt_view_gantt" model="ir.ui.view">
       <field name="name">view.gantt.view.gantt</field>
       <field name="model">view.gantt</field>
       <field name="arch" type="xml">
           <gantt date_start="start_date" date_stop="end_date"
                  default_group_by="partner_id" string="Customer">
               <field name="partner_id"/>
               <field name="start_date"/>
               <field name="end_date"/>
           </gantt>
       </field>
   </record>
   <record id="action_view_simple_gantt" model="ir.actions.act_window">
       <field name="name">Partners</field>
       <field name="type">ir.actions.act_window</field>
       <field name="res_model">view.gantt</field>
       <field name="view_mode">tree,form,gantt</field>
   </record>

   <menuitem id="menu_view_view_gantt"
             name="Simple Gantt"
             action="action_view_simple_gantt"/>
</odoo>Here we defined the view, let’s proceed to the next step. The Gantt tag comes with several attributes, offering basic features. The template attributes are particularly useful for displaying details of each bar as we hover over it. After that, we have to integrate the Gantt view mode into our action.
In addition to our existing form and tree modes, we’ve now included the Gantt view model. Let’s take a closer look at how this code impacts our application.
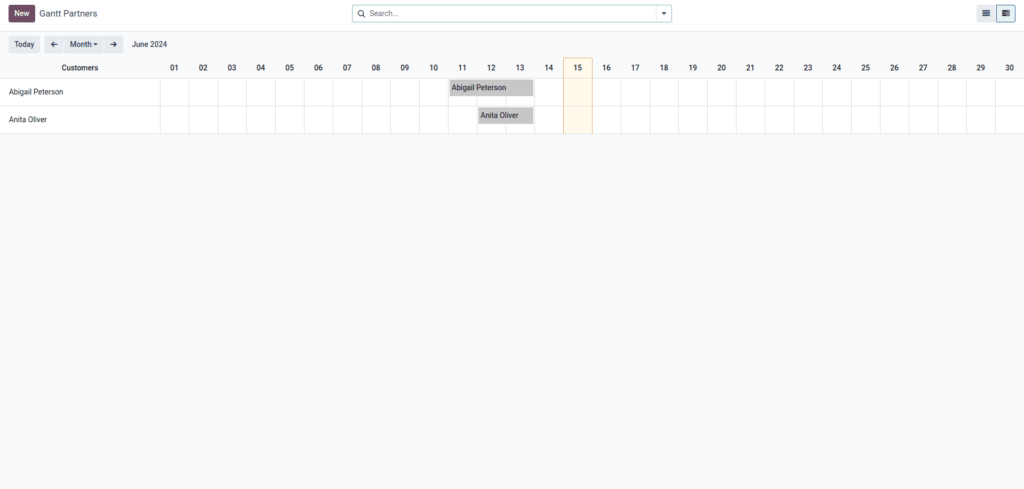
If you want to add a new record, click on the “Add” button. You can filter data by week, year, or day. Different colors represent diverse allocations. You can also try varying the properties inside the Gantt tag to get more features.
Tips for a Better Gantt Chart
Here are some pro tips for a better Gantt Chart experience in odoo:
Use Groups in <gantt>
You can group your tasks by employee, project, or department for better clarity.
<gantt date_start="start_date" date_stop="end_date" progress="progress" string="Schedule" default_group_by="assigned_to">Add Color Coding
Use the color An attribute in your model to define different statuses visually.
color = fields.Integer(string="Color Index")When Not to Use Gantt View?
Although Gantt charts are helpful, they’re not always the best choice. Avoid using them when:
- You only have a few records and short durations
- You don’t track start/end dates
- Tasks aren’t time-sensitive
In such cases, a Kanban, list, or calendar view might be more effective and cleaner for users.
Related Post:
>> How to Add Chatter in Form View in Odoo 17
>> Odoo.sh VS Odoo Online VS Odoo On-Premises
Conclusion for How to Create Gantt View in Odoo 17
We reviewed the fundamentals of creating a Gantt view in Odoo 17, looking at how it provides a streamlined and visually appealing solution to project planning and task management. We talked about the important features and characteristics, such as start_date, end_date, and default_group_by, that enable you to modify the Gantt view to display crucial information in an ordered, horizontal timeline structure. As previously stated, Gantt views require the ‘web_gantt’ module, which is only accessible in the Odoo Enterprise Edition.
By following the methods and examples provided, you should have a strong understanding of how to create a Gantt view in Odoo 17 and integrate it into your application. Experiment with different features to fully exploit the possibilities of Gantt views, which improve project visualization and resource allocation.

