


Data visualization is essential for making information more understandable and interactive. This tutorial will teach us how to create dynamic charts in PHP using ChartJs. Whether it’s a Pie, Doughnut, or Bar chart, Chart.js provides an easy way to display data dynamically. By integrating PHP with Chart.js, you can fetch real-time data from a database and represent it visually. Let’s explore the step-by-step process to implement dynamic charts in your PHP project.
In this tutorial, we will learn about doughnut, pie, and bar charts that will help you make a dynamic chart. We will use PHP as the backend language to store data in a MySQL database.
Table of Contents
Difference Between Doughnut, Pie, and Bar Charts:
| Feature | Doughnut Chart | Pie Chart | Bar Chart |
| Shape | Circular with a hole in the center | Fully circular | Rectangular bars |
| Data Representation | Displays proportions with a center cut-out | Shows proportional distribution | Compare values across categories |
Before starting the Tutorials, I am hoping everyone has installed XAMPP or WAMPP on their System. If not, please download Xampp and Wampp.
Steps to create dynamic charts in PHP using ChartJs:
Looking to visualize data in your PHP project? Chart.js is a powerful JavaScript library that lets you create interactive and responsive charts with ease. In this guide, we’ll walk you through the process of generating dynamic charts using PHP and Chart.js.
Begin by creating a PHP file (e.g., chart.php) in the htdocs folder if you’re using XAMPP, or in the www folder if you’re using WAMP. Next, set up a MySQL database named chart and create a table to store your data—here, we’ll also name the table student.
To display the chart on your web page, include the Chart.js library by adding the following script tag:
<script src="https://cdn.jsdelivr.net/npm/chart.js"></script>PHP Code to Show The Charts:
<?php
// Database connection
$conn = mysqli_connect("localhost", "root", "", "chart") or die("Connection Failed");

if ($_SERVER["REQUEST_METHOD"] == "POST") {
    $math = $_POST['math'];
    $physics = $_POST['physics'];
    $chemistry = $_POST['chemistry'];
    $computer = $_POST['computer'];

    if (!empty($math) && !empty($physics) && !empty($chemistry) && !empty($computer)) {
        $insert = "INSERT INTO `student` (`Math`, `Physics`, `Chemistry`, `Computer`) VALUES ('$math', '$physics', '$chemistry', '$computer')";
        if (mysqli_query($conn, $insert)) {
            header("Location: " . $_SERVER['PHP_SELF']);
            exit();
        }
    }
}

$sql = "SELECT * FROM student";
$result = mysqli_query($conn, $sql);

$students = [];
while ($row = mysqli_fetch_assoc($result)) {
    $students[] = $row;
}

$students_json = json_encode($students);
?>

<!DOCTYPE html>
<html lang="en">
<head>
    <meta charset="UTF-8">
    <meta name="viewport" content="width=device-width, initial-scale=1.0">
    <title>Student Marks Chart</title>
    <link rel="stylesheet" href="https://maxcdn.bootstrapcdn.com/bootstrap/3.4.1/css/bootstrap.min.css">
    <script src="https://cdn.jsdelivr.net/npm/chart.js"></script>
</head>
  <style>
        .chart-container {
            display: flex;
            flex-wrap: wrap;
            justify-content: center;
            gap: 20px;
        }
        canvas {
            max-width: 100%;
            height: auto;
        }
        @media (max-width: 768px) {
            .chart-container {
                flex-direction: column;
                align-items: center;
            }
        }
    </style>
</head>
<body>

<div class="container">
    <h2>Insert and Display Student Data</h2>
    <form action="" method="post">
        <label>Math</label>
        <input type="number" name="math" required/><br>

        <label>Physics</label>
        <input type="number" name="physics" required/><br>

        <label>Chemistry</label>
        <input type="number" name="chemistry" required/><br>

        <label>Computer</label>
        <input type="number" name="computer" required/><br>

        <input type="submit" value="Submit"/><br>
    </form>

    <h3>Student Records</h3>
    <table class="table table-bordered">
        <thead>
            <tr>
                <th>ID</th>
                <th>Math</th>
                <th>Physics</th>
                <th>Chemistry</th>
                <th>Computer</th>
            </tr>
        </thead>
        <tbody>
            <?php foreach ($students as $student) { ?>
            <tr>
                <td><?php echo $student['id']; ?></td>
                <td><?php echo $student['Math']; ?></td>
                <td><?php echo $student['Physics']; ?></td>
                <td><?php echo $student['Chemistry']; ?></td>
                <td><?php echo $student['Computer']; ?></td>
            </tr>
            <?php } ?>
        </tbody>
    </table>

    <h3>Student Marks Visualization</h3>
    <label for="studentSelect">Select Student ID:</label>
    <select id="studentSelect"></select>

    <div class="chart-container">
        <canvas id="doughnutChart"></canvas>
        <canvas id="pieChart"></canvas>
        <canvas id="barChart"></canvas>
    </div>
</div>

<script>
    const students = <?php echo $students_json; ?>;
    const studentSelect = document.getElementById("studentSelect");
    students.forEach(student => {
        const option = document.createElement("option");
        option.value = student.id;
        option.textContent = `Student ${student.id}`;
        studentSelect.appendChild(option);
    });

    const ctxDoughnut = document.getElementById("doughnutChart").getContext("2d");
    const ctxPie = document.getElementById("pieChart").getContext("2d");
    const ctxBar = document.getElementById("barChart").getContext("2d");

    let doughnutChart, pieChart, barChart;

    function updateChart(studentId) {
        const student = students.find(s => s.id == studentId);
        const marks = [student.Math, student.Physics, student.Chemistry, student.Computer];
        const labels = ["Math", "Physics", "Chemistry", "Computer"];
        const colors = ["red", "blue", "green", "yellow"];

        if (doughnutChart) doughnutChart.destroy();
        if (pieChart) pieChart.destroy();
        if (barChart) barChart.destroy();

        // Doughnut Chart
        doughnutChart = new Chart(ctxDoughnut, {
            type: "doughnut",
            data: { labels,
                 datasets: [{ data: marks, backgroundColor: colors }] },
            options: { responsive: false    , maintainAspectRatio: false }
        });

        // Pie Chart
        pieChart = new Chart(ctxPie, {
            type: "pie",
            data: { labels, datasets: [{ data: marks, backgroundColor: colors }] },
            options: { responsive: false, maintainAspectRatio: false }
        });

        // Bar Chart
        barChart = new Chart(ctxBar, {
            type: "bar",
            data: { labels, datasets: [{ label: "Marks", data: marks, backgroundColor: colors }] },
            options: { responsive: false, maintainAspectRatio: false }
        });
    }

    if (students.length > 0) {
        updateChart(students[0].id);
    }

    studentSelect.addEventListener("change", function() {
        updateChart(this.value);
    });
</script>

</body>
</html>Code Explanation:
Firstly, I made only one file, you can create them differently.
This tutorial walks you through the full process of collecting student marks, storing them in a database, displaying them in a table, and finally showing them as dynamic charts using Chart.js. Here’s a step-by-step breakdown:
1. Create the Database and Table
Start by creating a MySQL database named chart. Inside it, create a table that can store marks for four subjects: Math, Physics, Chemistry, and Computer. This structure will help organize the student data.
2. Connect PHP to the Database
Use PHP’s built-in mysqli_connect() A function to connect your PHP application to the MySQL database. If the connection fails, you can handle the error accordingly. This step is essential to interact with the database for inserting and retrieving data.
3. Design the Form to Enter Marks
Using HTML and Bootstrap (for styling), create a form with input fields for the four subjects. Each field should be required to ensure users don’t leave any subject blank. Set the form method POST so that data is securely sent to the server when submitted.
4. Insert Marks into the Database
When the form is submitted, check if the request method is POST. If yes, collect the submitted values for each subject. Then, use an SQL INSERT query to save this data into your database table. This step ensures that each student’s marks are safely stored.
5. Fetch and Display Data in a Table
After storing the data, fetch all student records using a SELECT query. Loop through the results and display them in a structured HTML table. Each row will represent a student’s marks, making it easier to review the data before visualizing it.
6. Convert PHP Data to JavaScript
To use the student data in JavaScript for charting, convert the PHP array into a JSON object using json_encode(). This allows you to pass the data to your front-end JavaScript code and access it as a usable object.
7. Create a Dropdown to Select a Student
Use the student data to dynamically generate a dropdown list. Each option in the dropdown represents a student (usually by their ID or name). When a user selects a student, the corresponding chart will update to show that student’s marks.
8. Set up Chart.js and Canvas Elements
Include Chart.js in your HTML via a CDN. Then, create three <canvas> elements for each chart type: Doughnut, Pie, and Bar. These act as containers where the charts will be displayed.
9. Generate Charts Dynamically
Using JavaScript, access the selected student’s data from the dropdown. Use Chart.js to create and display the marks in all three chart types. Before rendering a new chart, destroy the existing one to avoid duplicate overlays. Each chart uses different styles but displays the same mark data for better understanding.
10. Make It Interactive
By default, display the first student’s chart. When a different student is selected from the dropdown, update the charts dynamically. This makes the interface interactive and user-friendly.
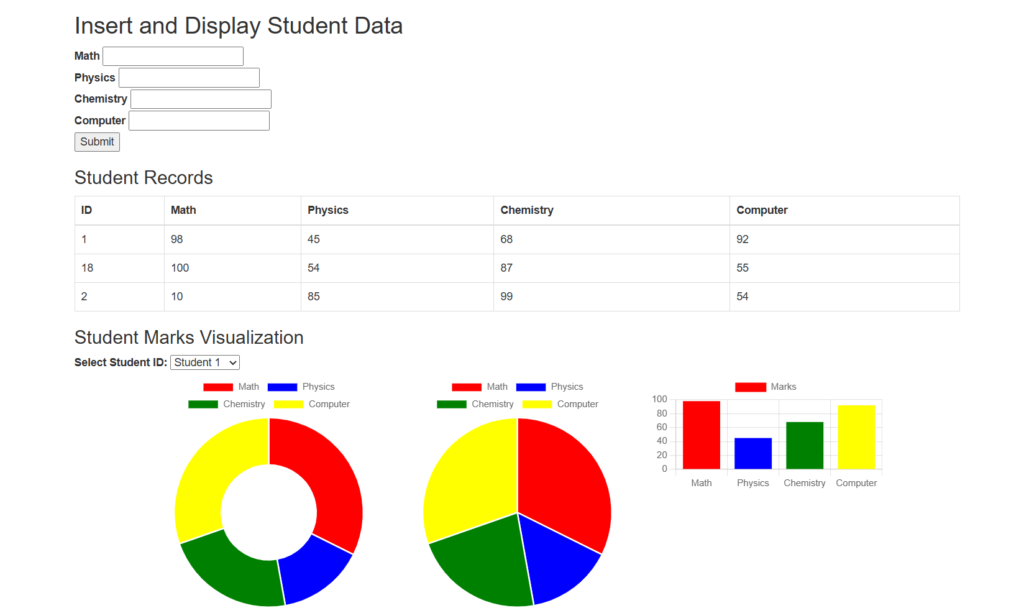
OUTPUT:
Output Video:
Related Posts:
>>How to Upload Multiple Files Using jQuery Ajax in PHP?
Conclusion:
Creating dynamic charts in PHP using Chart.js is a powerful way to visualize student data and make it easier to understand. By following the steps in this tutorial— connecting to a database, collecting input through a form, storing the data, and rendering it as interactive charts—you can build a user-friendly system to track and display marks in real time. This approach is not only useful for educational projects but also scalable for any data-driven application. Start using Chart.js with PHP today to bring your data to life through engaging and responsive charts.